
Engineered pipeline performance.
We replace vague creative concepts with high-yield customer acquisition systems. Review the audited performance metrics and logistics scale case studies below.
Verified pipeline acceleration.
3.2x
10.3%
49%
Our average increase in qualified leads within the first nine months of pipeline deployment.
Our clients typically see a 49% increase in closing percentage when we create their website and qualify their leads.
Our landing page conversion rate is 10.3%. The average landing page conversion rate is only 2.9%.


Acquisition engines in action.
Two deep-dives into how we align technical positioning with complex procurement cycles to secure high-value enterprise contracts.
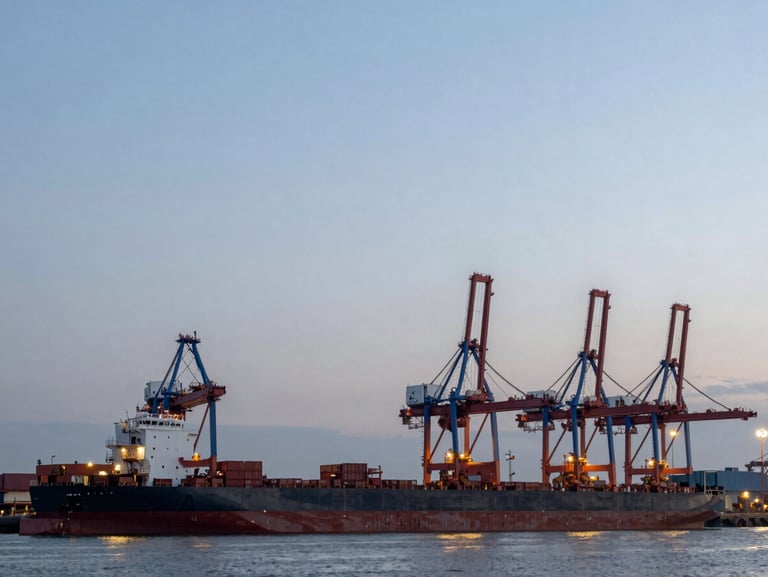
Logistics pipeline architecture.
We rebuilt the positioning strategy for a national freight carrier, targeting supply chain directors with high-conviction technical data instead of generic marketing copy.
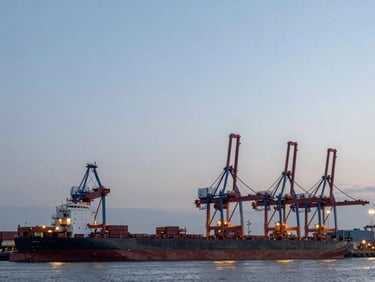
Heavy machinery acquisition.
For an industrial equipment manufacturer, we engineered a systemized lead-generation pipeline that aligned perfectly with their twelve-month enterprise sales cycle.
Audit your pipeline.
Let us identify the friction points in your current enterprise sales cycle. We will deliver a technical assessment of your customer acquisition engine.